System Monitor
The System Monitor class is a helper class used to monitor the framework while it is running.
System Monitor Interface
The System Monitor is divided into four sections, each providing different diagnostic information about the running application.
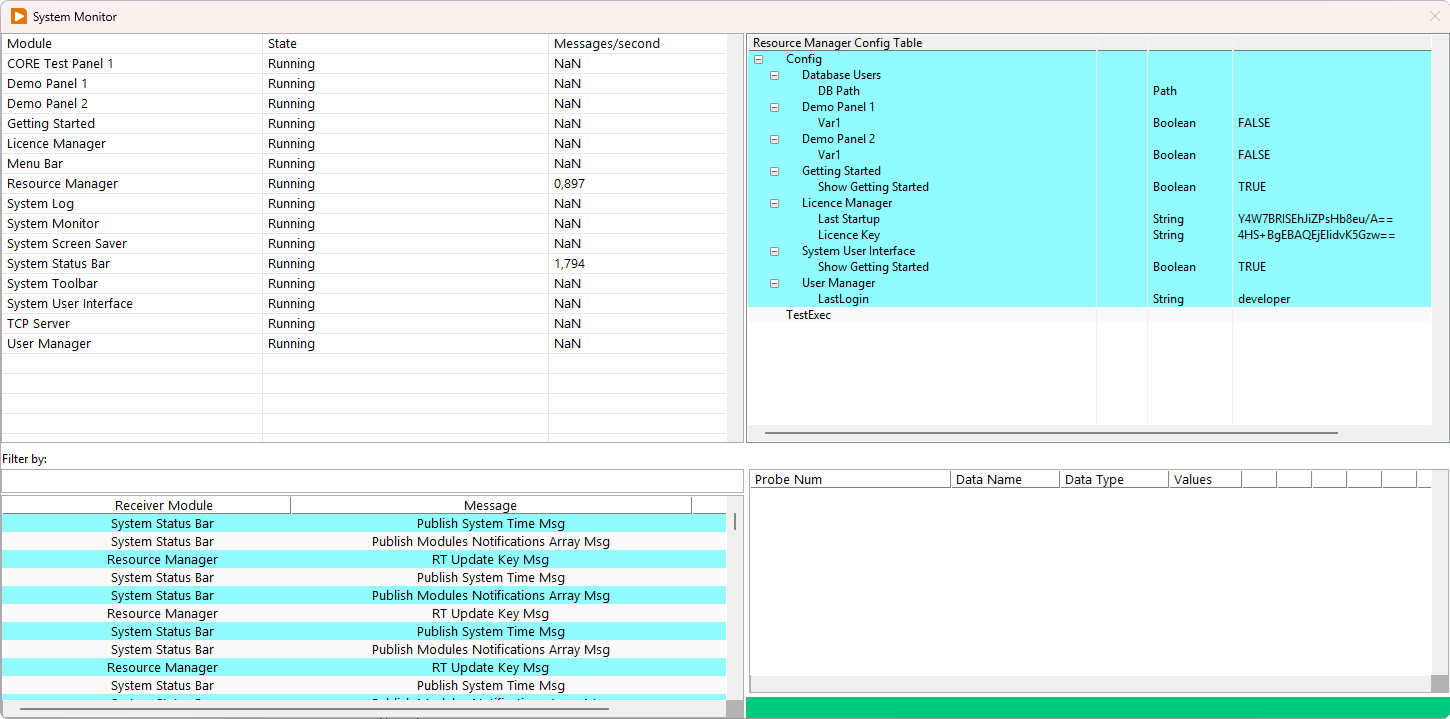
1Module State Summary
Lists all running modules with their current state and message throughput (messages per second)
2Resource Manager Config
Hierarchical tree view of all configuration variables managed by the Resource Manager, showing data types and current values
3Message Data Display
Live stream of messages flowing between modules. Can be filtered by receiver module or message type
4Probe Data Display
Detailed view of selected probes, showing data names, types, and current values
Double-clicking a module name in the Module State Summary [1] opens the Module Table Inspector Window for that module.
Module Table Inspector Window
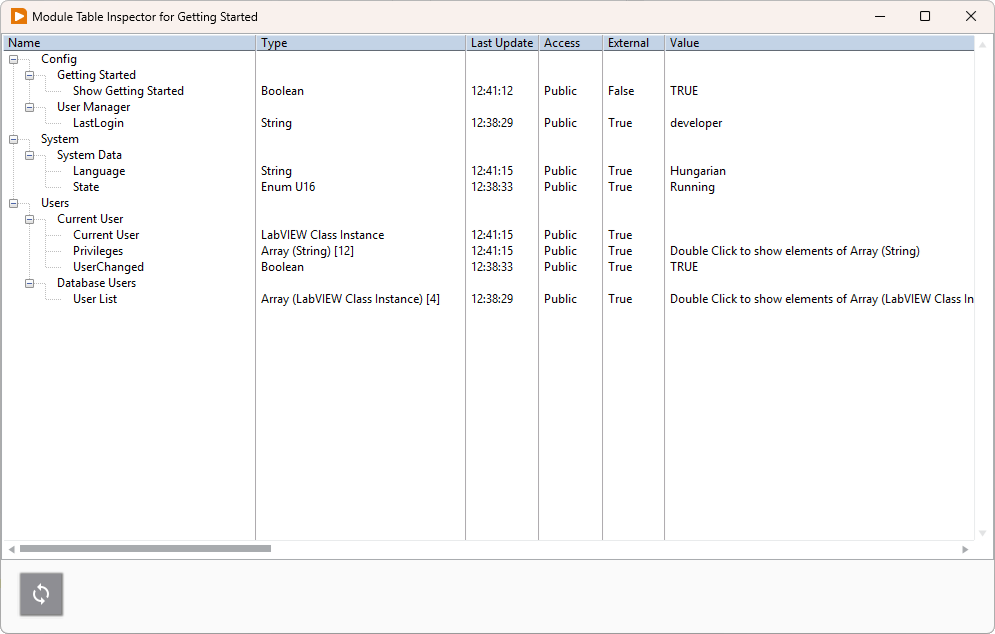
The Module Table Inspector displays the module’s variables in a tree structure, allowing you to inspect and modify their values in real time.
Features
Tree View DISPLAY
Variables are organized in a hierarchical tree structure for easy navigation
Refresh Button CONTROL
Manually refresh the displayed values to see the latest state
Expand Complex Types INTERACTION
Double-click clusters and arrays to expand and view their individual elements
Quick Refresh INTERACTION
Double-clicking a non-expandable variable refreshes its value
Inline Editing EDIT
Modify Module Table variable values directly in the Value column
Inline editing makes the inspector a powerful debugging tool — you can adjust module state on the fly without restarting or recompiling.